 (animated GIF, 2.13
MB)
(animated GIF, 2.13
MB)tracking of a Sputnik user whose tag is easily identifyable because its reset counter starts from > 0xf000;
(using first 660 frames covering Dec. 27, 20:57 to Dec. 28, 14:19)
cat log-* > log.bin
cvtbeacon log.bin > log.txt
cut -d \ -f 1,2 log.txt | python beaconstat.py to compute histogram data for plotting
cut -d \  -f 1,2,3 log.txt | python
beaconadjacency.py
to compute graphviz plot showing receiver adjacency the actual Sputnik data is available from here (under CC-A-NC-SA 2.5)
Note: file log-2006-12-27-13 is corrupt; 8 bytes at offset 0xc4ff8 must be deleted!
(animated GIF, 2.13
MB)
tracking of a Sputnik user whose tag is easily identifyable because its
reset counter starts from > 0xf000;
(using first 660 frames covering Dec. 27,
20:57 to Dec. 28, 14:19)
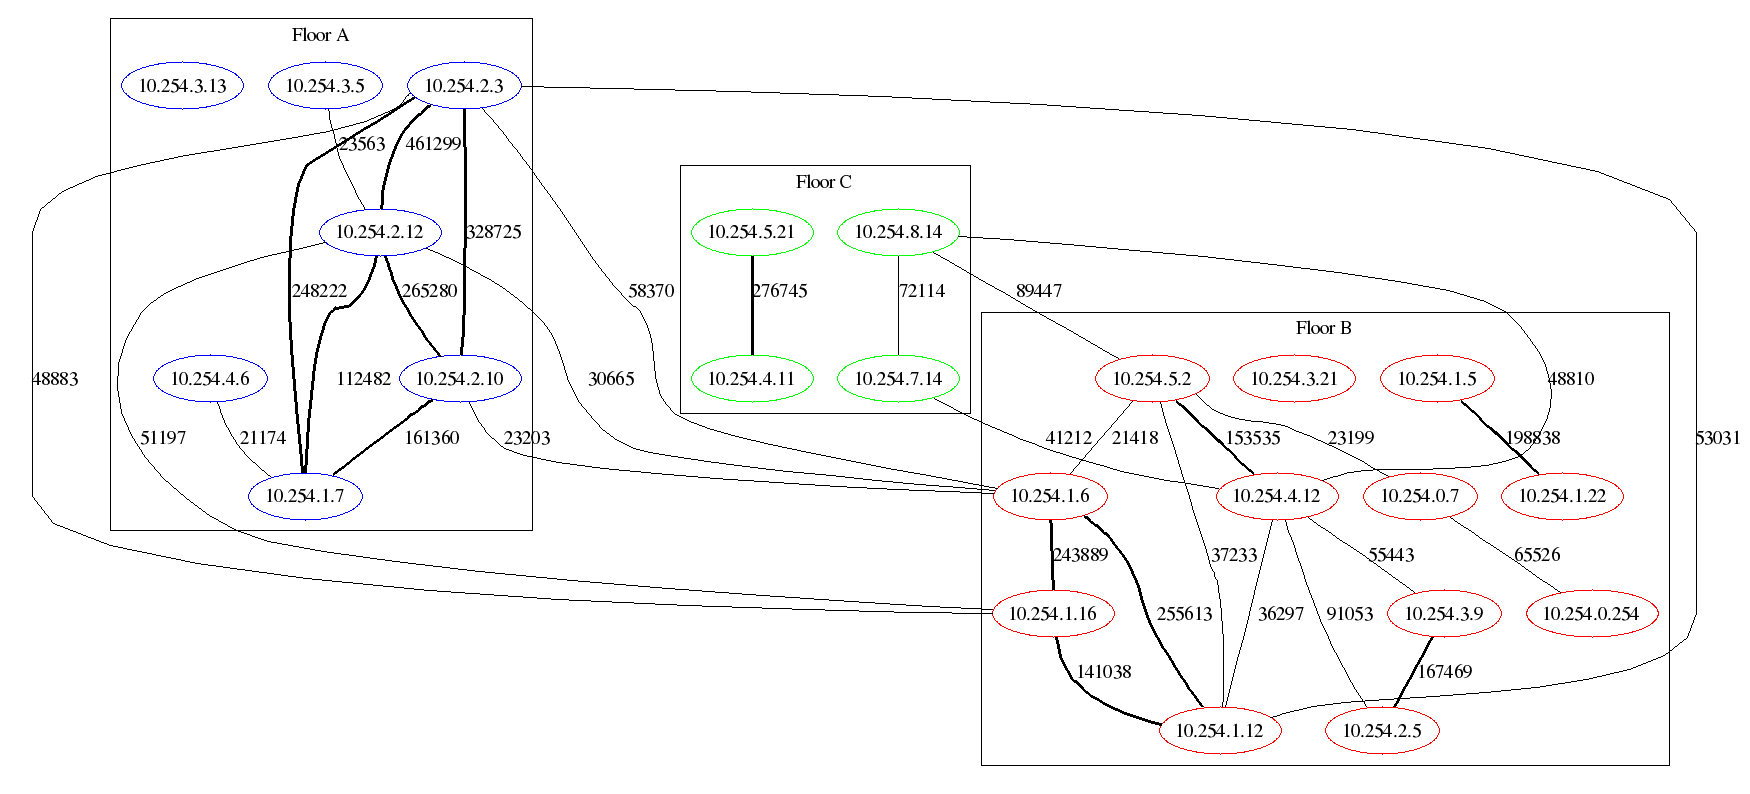
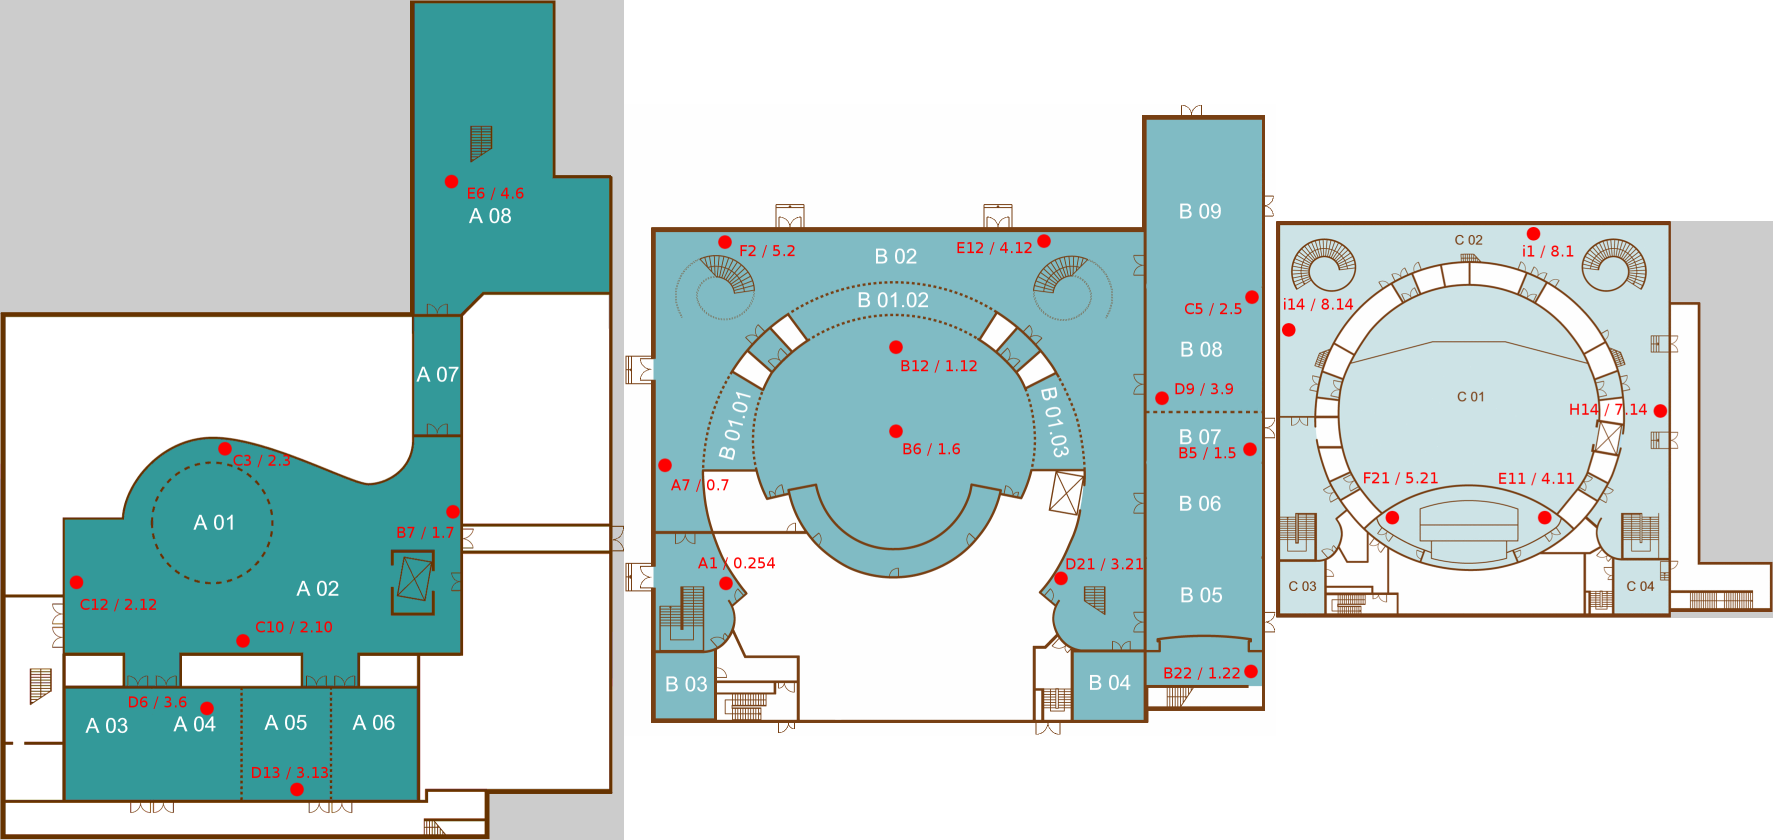
receiver adjacency (note: 1.16 and 3.5 have been assigned to floor plan
according to analysis);
numbers on edges indicate the trackings received simultanously by two
receivers
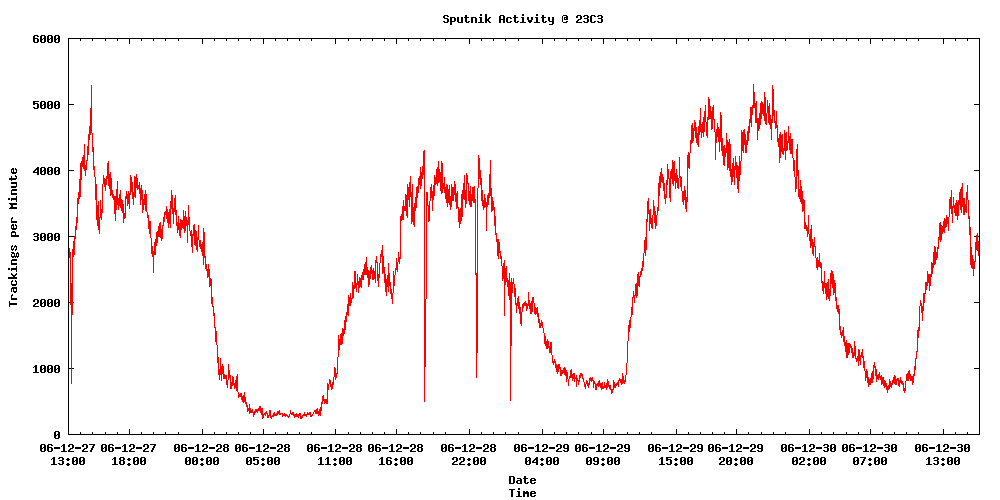
trackings per minute (total)
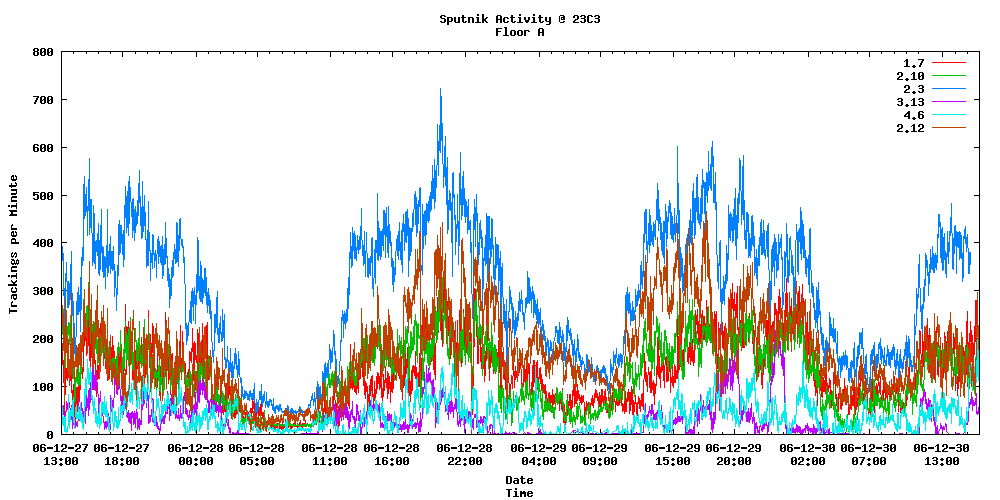
trackings per minute (for the individual receiver IPs on floor A)
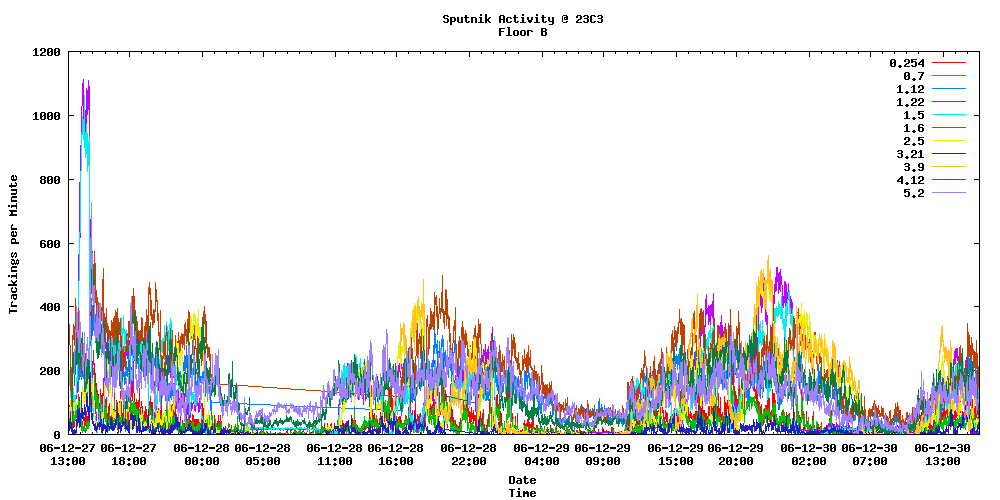
trackings per minute (for the individual receiver IPs on floor B)
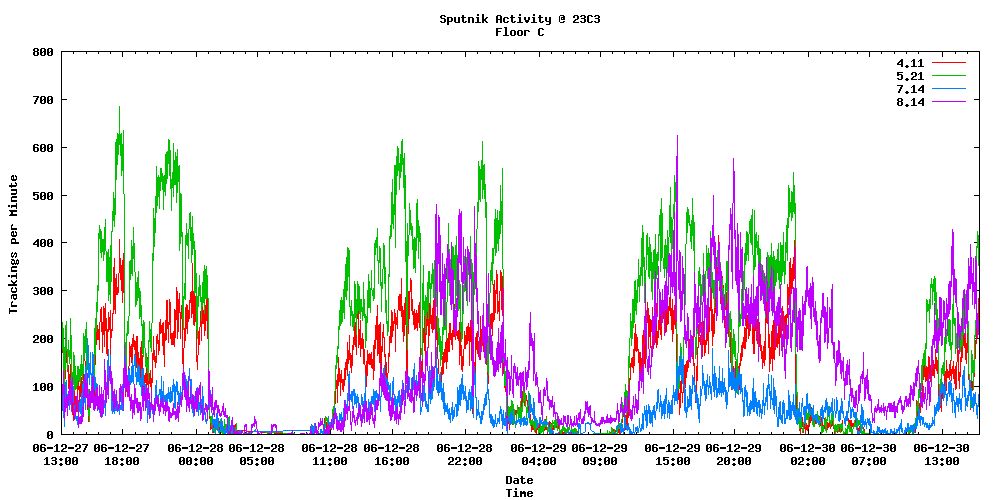
trackings per minute (for the individual receiver IPs on floor C)